Time limit is exhausted. Please reload CAPTCHA. 4 × = twenty eight
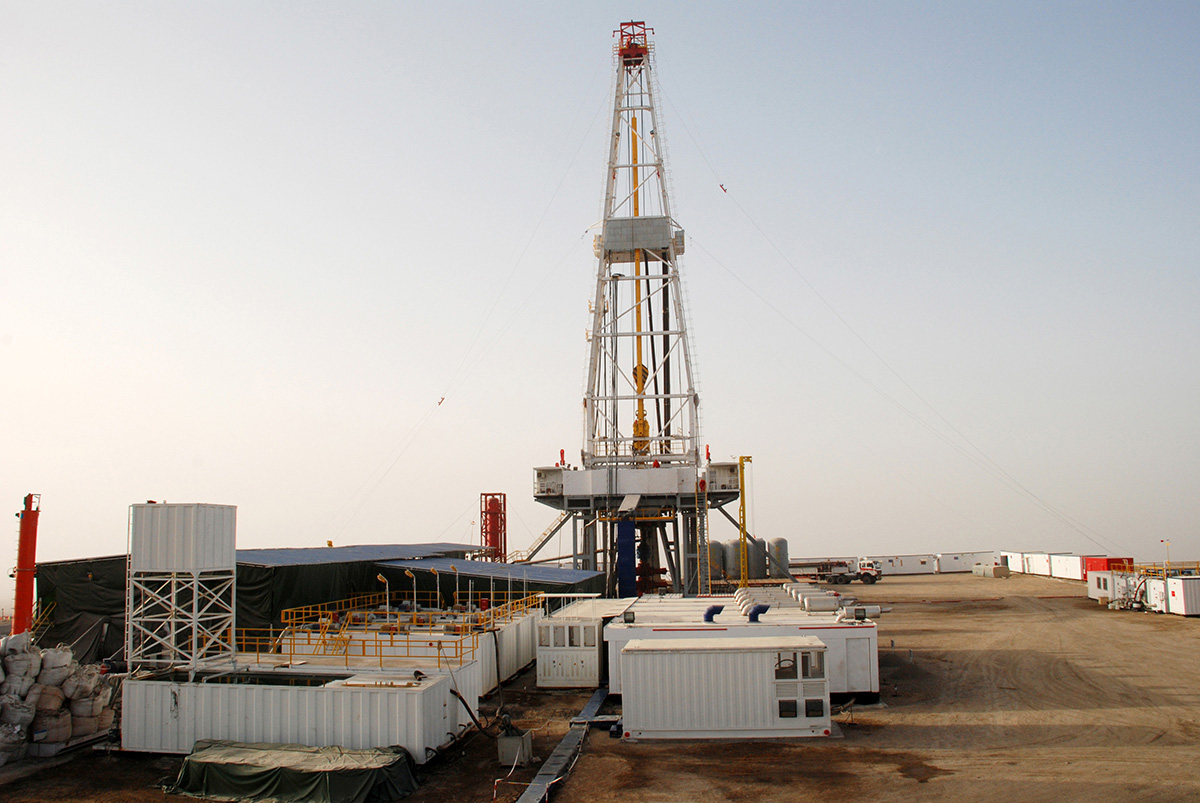
CANTY specializes in Mud Flow Analysis as well as Drilling Mud PSA.
Name
Email address
Phone
Inquiry
Features:
• Volume Flow Analysis
• Fluid Front Detection
• Real-Time Viewing
• Lab Particle size down to 1µm
• Analysis of oil or water based mud
• Detect oil / water / solids / gas
• Inline Particle size down to 1µm
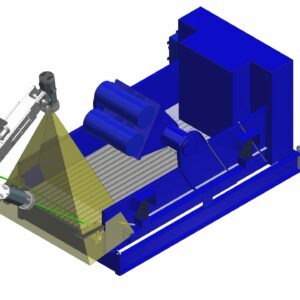
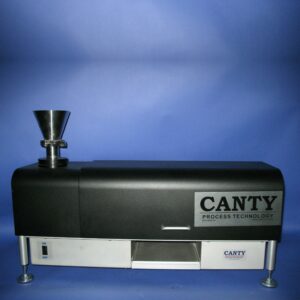
The CANTY SolidSizer™ is a vision-based sensor used with the CANTY Vector System image processor for dry sand size measurement in a laboratory environment. The CantyVision™ Software accurately measures multiple aspects of the sand from area / perimeter / minor and major axis / etc. In comparison to a sieve which measures only minor axis the CantyVision™ software can correlate directly to a sieve so the customer does not have to change any QC documents. The SolidSizer™ can correlate within 2% of a sieve. A typical sieve analysis takes anywhere from 20-30 minutes including cleaning and setup for a 70-100 gram sample. On the SolidSizer™ that same sample takes less than 2 minutes. Also multiple screen distributions can be setup to accommodate multiple customers or areas in the process, hence eliminating the need for multiple runs on the same sand for different size distributions. After correlating to current methods of minor axis, customers find benefit in comparing minor axis to major axis and making sure the sand is round instead of needle shaped. Reduce lab time and make sure production samples are not skipped over due to lack of sample time available!
The CANTY Ultratemp™ is a vision-based camera system used with the CANTY Vector System image processor to monitor temperature of the tubes inside a hydrogen reformer. The CantyVision™ Software accurately measures temperature as well as bend in the tube for complete control. In comparison to thermocouples which are costly, not reliable, and monitor only one tube, a camera system can monitor multiple tubes at the same time. The CantyVision™ software can output a signal to alarm if the tube has increased in temperature over a certain time to an operator screen, PLC, or DCS for closed loop control. The steam can then be introduced to clean the tube and avoid plugging and then switch back to the natural gas. The pyrometer is not effective for controlling the temperature in the reformer due to the time intervals in between analysis is taken. Also, not everyone measures at the same point and this could lead to a change in temperature when a change never occurred. To calibrate the system the pyrometer can be used initially. If the temperature in the tubes increase over 10°C over 10 min, a plug has a chance to take place. With the Ultratemp™ this event can be avoided completely.
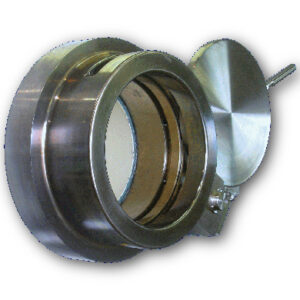
• Conforms to ASME Section B 31.1, B31.3 and PED • Pressure ratings from full vacuum to 10,000 psi, 300F • No bolting or Torqueing • Zero Leak Closure • Dual Seal • Welded, ANSI or DIN mounting • Duplex Stainless, Super Duplex, and various Alloys • Sizes 1” – 20” available • Optional NACE and corrosion liners
Interface control is crucial for ensuring different components of a system or project can interact effectively and predictably. CANTY’s Image System for Continuous Interface Measurement is key for defining and managing the boundaries and interactions between interfaces. By controlling interfaces, projects can avoid costly rework, delays, and integration problems, ultimately leading to a more successful and efficient outcome.
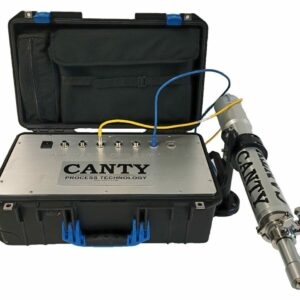
The Portable InFlow for OIW/WIO analysis is a rugged analyzer meant for the extreme environments of the petroleum exploration industry. It is a dual analyzer handling the detection of oil in water, or water in oil, depending on the application. It can be quickly installed to take process fluids off line through sampling valves and provide analysis results. The system is easily flushed clean.